We all know the importance of monitoring the application or system for specific metrics. Monitoring provides high-level metrics such as request counts, latency, throughput, or drift detection. Observability goes further, giving you insights inside your application: how long individual functions take, which database queries are slow, or how long an LLM call takes. In short, monitoring shows what happened; observability shows why.
In this post, we’ll explore how to implement observability in Python using Pydantic Logfire, with examples ranging from simple scripts to FastAPI applications and LLM-based services.
There are many libraries for implementing observability, depending on your preferred programming language. The most popular of them being OpenTelemetry which is language agnostic. It is open source and provides support for logging, tracing, metrics. Among these, Pydantic Logfire stands out as a platform built on OpenTelemetry, designed for any language but with particularly strong support for Python.
We will explore 3 examples of using Logfire in the Python application. Starting with a simple Python application followed by a FastAPI + database application and finally an advanced LLM based application.
The code for all the 3 application: https://github.com/dudeperf3ct/logfire-examples
Python Application
Let’s start with a simple Python script to see Logfire in action.
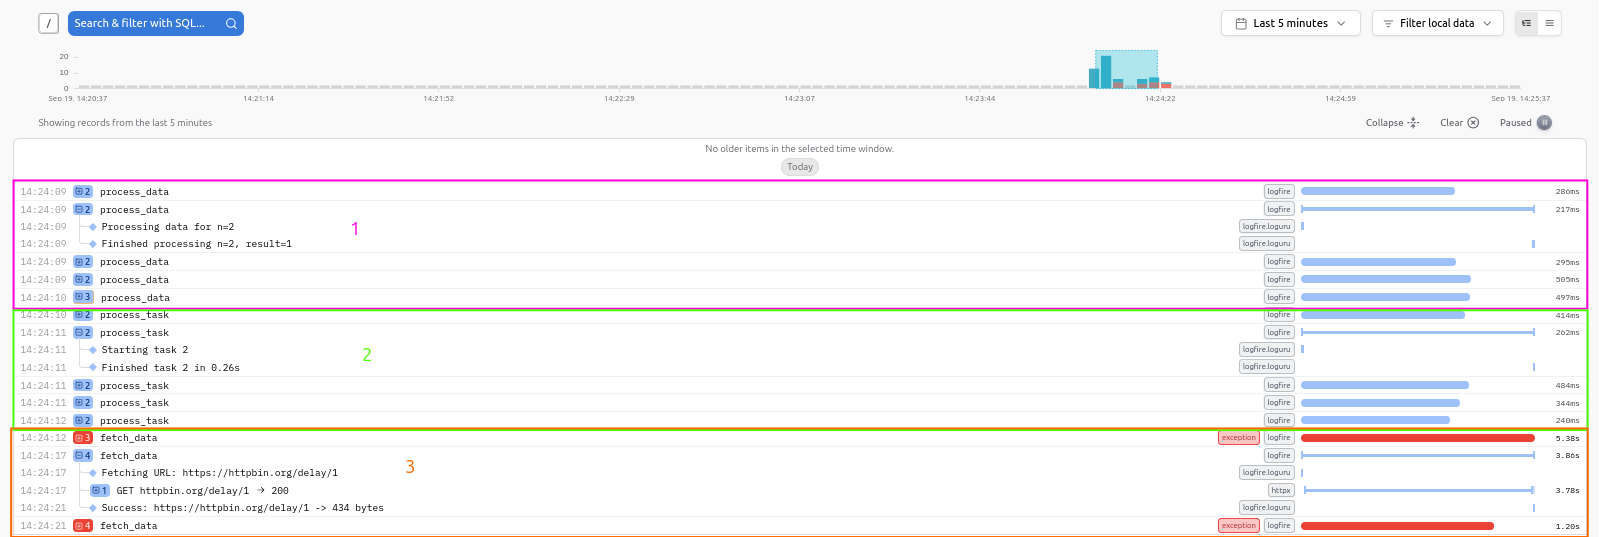
Simple Python application
There are 3 separate functions that are traced and logged as shown in the image above. Each function is traced separately, with execution time and logs captured automatically.
FastAPI Application
Next, let’s explore a FastAPI application with a database backend. The FastAPI application uses a SQLAlchemy database to store and retrieve users. The figure below shows time taken to start the application and time spent for each request at the particular endpoints.
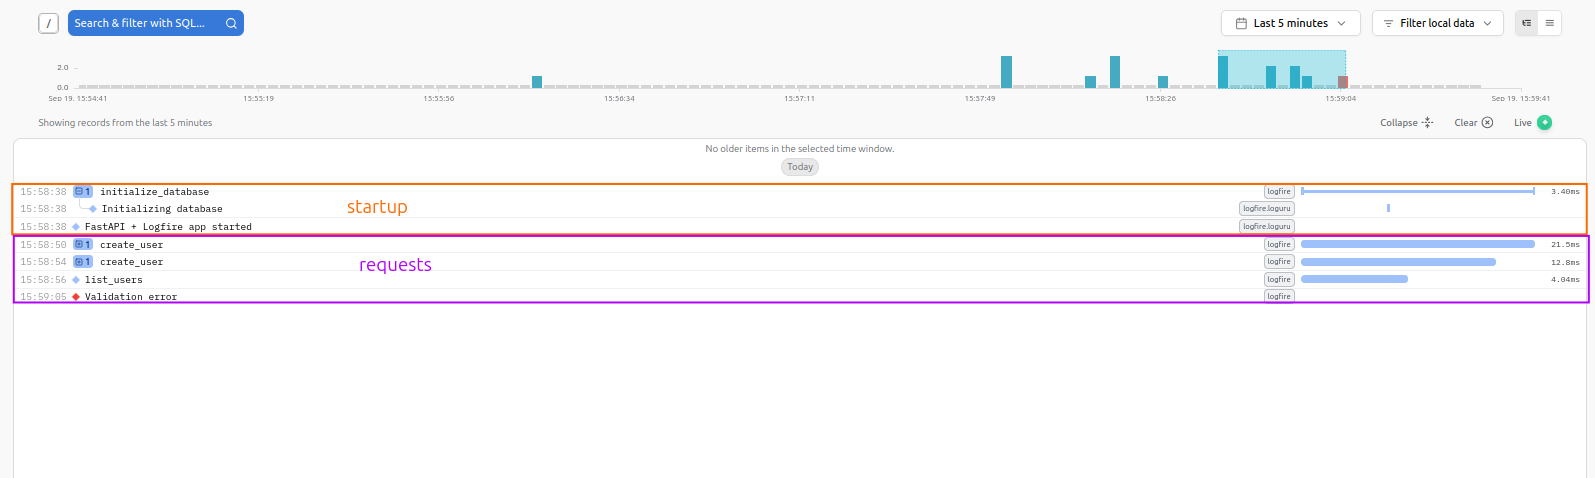
FastAPI database application
While Logfire provides default dashboards, you can create custom metrics views using SQL queries to track application-specific metrics. The metrics interface in Logfire dashboard felt unintuitive. The SQL query below was used to create a panel for getting number of users created over time.
SELECT
  time_bucket($resolution, recorded_timestamp) AS time,
  sum(scalar_value) AS total_users_created
FROM metrics
WHERE metric_name = 'users_created_total'
  AND recorded_timestamp > now() - interval '6 hours'
GROUP BY time
ORDER BY time
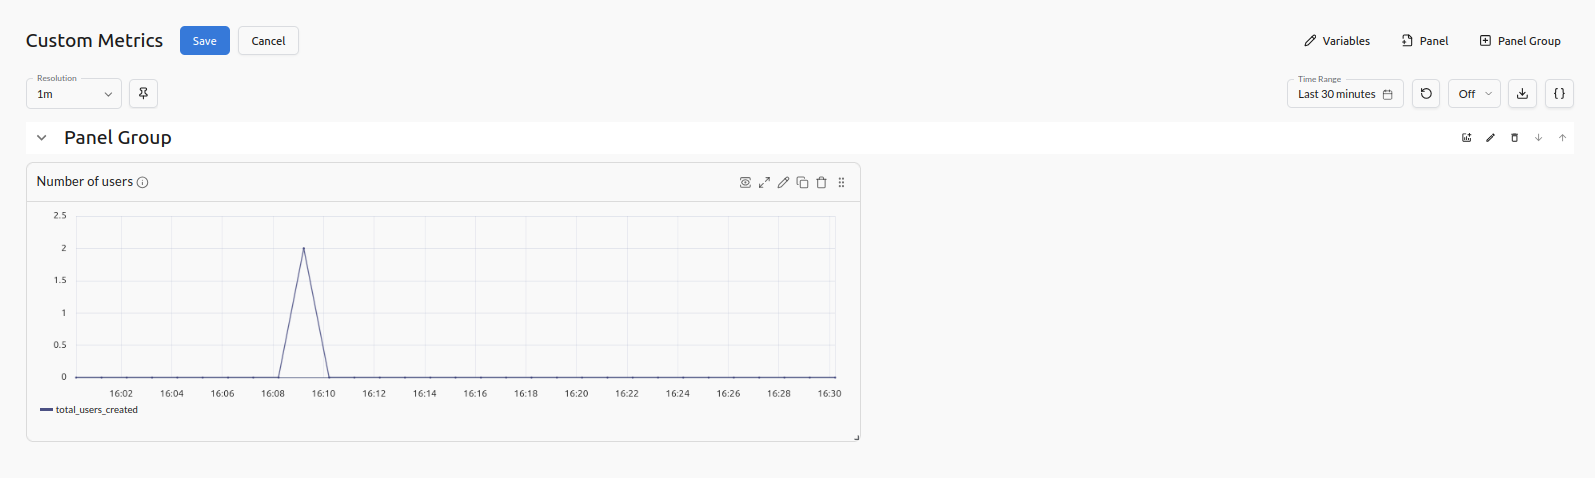
Custom metrics dashboard
The observability in this application might help providing insights using following
Traces
- Which endpoints are slowest, and why? (e.g.
/list_users→ slow due to DB query time) - How much time is spent in request handling vs DB queries? (using spans like initialize_database, list_users, etc.)
- Which requests failed and what were the error details? (422 validation errors, DB integrity errors)
Logs
- What were the last 100 errors users encountered?
- Which inputs caused validation failures?
- Which users were just created, and with what attributes? (structured logs attached to spans)
Metrics
- How many users were created over the last hour/day/week? (
users_created_total) - What is the success vs failure rate of requests?
- What’s the average latency per endpoint?
- How often are DB initialization / migrations run?
LLM Application
LLM application consists of a FastAPI application with an endpoint that sends requests to LLM. litellm library acts as an LLM gateway.
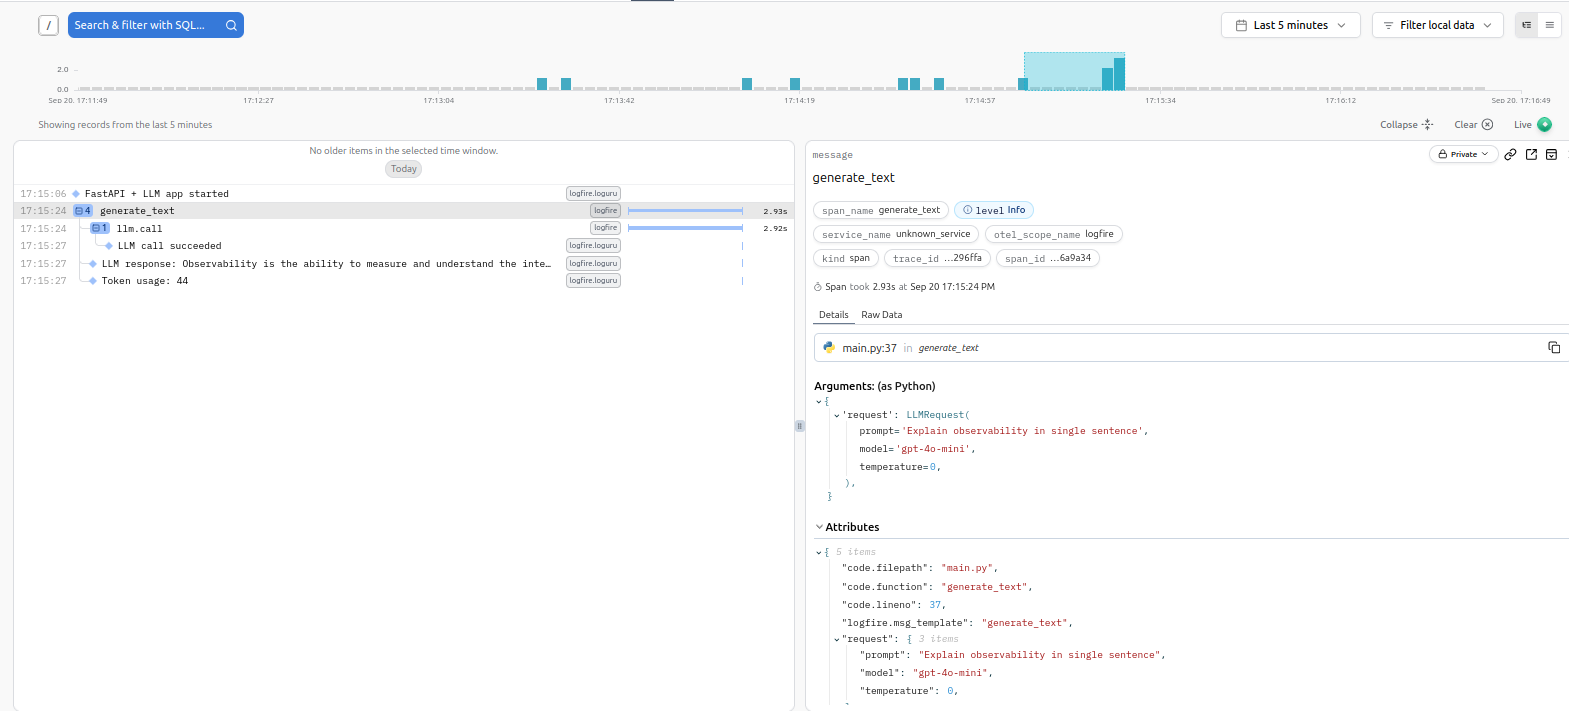
LLM application
A custom metrics dashboard provides insights into usage of LLM tokens, latency and requests.
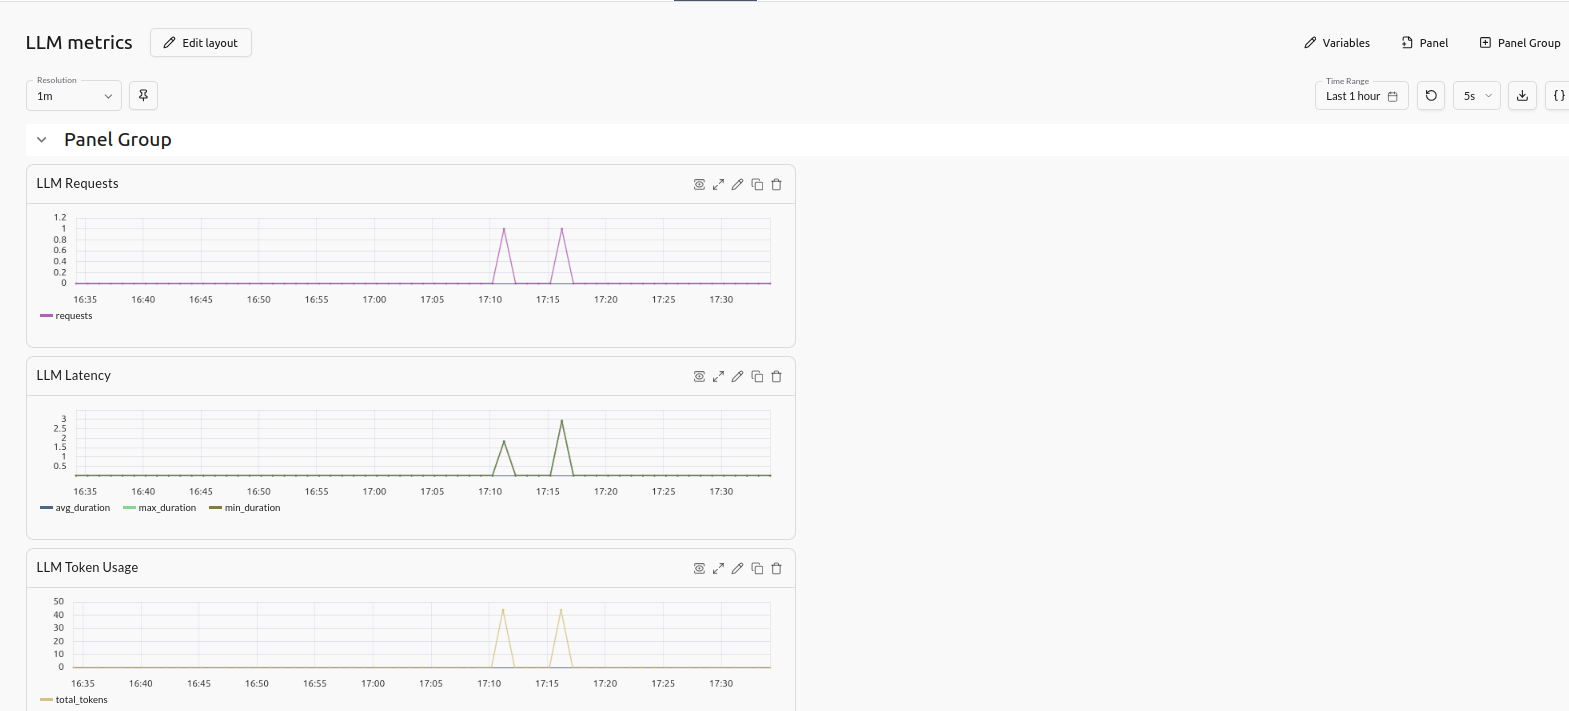
LLM metrics dashboard
With Logfire, you can monitor LLM requests, tracing the time spent in FastAPI vs the LLM call, logging errors, and tracking metrics such as latency, tokens used, and request volume.
Traces
- How long does each LLM request take end-to-end?
- How much of request time is spent in the FastAPI endpoint vs outbound LLM call?
- Which requests failed (timeouts, rate limits, etc.) and how often?
- Can I correlate user request → LLM prompt length → latency/tokens used?
Logs
- Did a particular LLM call fail, and with what error?
- For successful calls, how many tokens were used?
- Are certain prompts consistently triggering warnings (too long, empty, etc.)?
Metrics
- How many LLM requests are served per minute/hour/day? (
llm_requests_total) - What’s the average / p90 / p99 latency of LLM requests? (
llm_request_duration_seconds) - How many tokens are consumed overall? (
llm_tokens_total) - What’s the error rate vs success rate of LLM calls? (
llm_requests_failed_total) - Does prompt length correlate with latency or token usage? (using attributes in metrics)
Slack alerts can also be set using Logfire.
So what?
It’s great to see one open source platform taking care of all the required necessities for an application such as logging, metrics and tracing. Another such open source platform I have encountered is Grafana. Of course there are closed-source solution that provide these functionalities as well such as Datadog, Arize AI Phoenix.
If I had to implement similar stack using open source solutions I would probably have to use OpenTelemetry for logging, tracing and metrics. Another approach would be to use fluentd/fluentbit for logging, Prometheus for metrics and using Tempo and Loki to pull all these together inside a Grafana dashboard. I think this system introduces a lot of moving parts. Pydantic Logfire eliminates the need for these components, but only at the application level. How does it handle infrastructure monitoring? For example, with Prom/Grafana stack we can get insights of the k8s at the cluster level. I am not sure if Python Logfire provides solution for K8s cluster monitoring yet.
Pydantic Logfire solves observability for any language application and reduces the burden of managing observability infrastructure. The starter plan is generous with 10 million spans/metrics offered free every month and rest is charged per usage. The problem that I have with hosted infrastructure is wrapping my head around the usage. The experimentation for the above 3 application took me about 2K span/metrics. This is where I would lean towards a self hosted solution.
Overall, I think Logfire simplifies observability at the application level, letting you focus on code rather than infrastructure. It remains unclear how Logfire handles monitoring and visualizing logs and metrics outside the application.